

Abstract
The use of lithium metal in secondary batteries has been impeded by its tendency to form dendrites: branching conductive structures of metal that can lead to capacity loss and, ultimately, internal shorts in the battery. Patterned electrodes, in addition to artificially increasing the current density of cells by increasing the surface area available for reaction, also generate a nonuniform electric field in the vicinity of the electrode surface. This nonuniform electric field, though rapidly screened by the electrolyte, can promote inhomogeneous deposition and Solid Electrolyte Interphase formation. As the consequence of these effects is not theoretically apparent since Solid Electrolyte Interphase volume and conductivity changes can, in principle, offset variations in local current density, we have performed experiments to examine the deposition of Li on nonuniform electrode surfaces using Atomic Force Microscopy. We measure the local variations in topography, SEI thickness, and composition, and discuss their implications for the formation of dendrites in Li metal.
Export citation and abstract BibTeX RIS
Lithium ion batteries are a significant technology to many fields because of their relatively large specific capacity and power density. A lithium metal anode would mean an approximately 10-fold improvement in current capacity over the theoretical limit of the graphite anode currently used, as well as a moderate improvement in cell voltage. 1 However, Li metal anodes are not currently used due to their propensity to form dendrites causing capacity loss, electrolyte depletion, and even more dramatic failures like internal shorts and thermal runaway. 1,2,3
In this manuscript, we examine the chemical composition and dielectric properties of the SEI that form on the surface of lithium when it is deposited on various metal anodes using Atomic Force Microscopy (AFM) methods. These metal anodes offer varying deposition overpotentials for Li, which impacts the SEI formation and homogeneity of Li deposition. In addition to observing local variations in the properties of the SEI that forms on these surfaces, a statistical analysis of discrete deposits that formed on the Au electrode suggests that topographic factors affect the deposition behavior of Li metal. Modelling to examine the behavior of the AFM tip during measurement further suggests that several observed features are related local conductivity in the sample. These variations are examined and their relevance to further experiments on anode samples is discussed.
Dendritic failure can be forestalled with patterned electrodes, which serve to decrease the local current density while avoiding rapid electrochemical deposition that encourages dendrite growth. 4 Consequently it is advantageous to understand the unique conditions that result from anodes patterned on small scales. AFM methods have proved useful for examining nonuniform electrode surfaces previously, as they can resolve surface properties on lateral scales similar to that of the probe diameter (as low as tens of nanometers) with both mechanical and electrical signals that allow for the contrast and identification of components of a nonuniform anode. 5 To that end, this paper examines the deposition behavior of Li on a patterned anode.
A patterned anode results in convex and concave regions, which affect the magnitude of the electric field near its surface. This means some combination of two effects will occur locally: an increased amount of charge will be required to screen the field produced by the electrode resulting in an increased concentration of salt species near the electrode; and initially an increased electric field could also result in an increased overpotential initially, resulting in a different ratio of reactions occurring. Both of these should accelerate the deposition of material due to their effect on the local electrochemical equilibrium. For this reason, it is expected for convex regions to promote nonuniform deposition at small current (compare and contrast the case of electrolyte depletion and Sand's time. 6
In addition to observing the behavior of Li deposition in a symmetric cell with Li metal electrodes, insight into the mechanisms involved can be gained by changing the anode material. This paper examines three anodes for Li metal deposition: copper, gold, and lithium. Cu has no coexisting solid solution or alloy phase with Li at room temperature, which requires the nucleation of a solid Li phase and a large deposition overpotential, changing the deposition kinetics significant. 7 Au has an intermediate behavior: several partially lithiated phases exist with smaller overpotentials, but the absence of a nucleation overpotential at 0 V vs Li/Li+ ensures kinetics similar to those on Li. 7 By comparing the Li deposition on these two and a Li metal anode, the mechanisms responsible for their observed deposition behavior can be understood.
Previous work has demonstrated the preferential growth of Li deposits using metals with different deposition overpotentials and the effect they have on the cycling performance of Li anodes. 7,8,9 Other works have probed the physical origins of this phenomenon, including some interesting computational results, but many of these have assumed a source of the behavior of Li (often compared with Mg) 10,11,12 ; this work instead allows for all relevant mechanisms of deposition of Li on a given anode to be observed, and the mechanisms contributing to these behaviors to be inferred from phenomenological simulation.
Experimental
For cycling purposes, samples consisting of pre-patterned metal plates (or Li coated Cu foil) were loaded into the Asylum Electrochemical cell (PEEK body, PTFE-tape gasket at sample, circular exposed area of 0.7 cm diameter) and supported by a metal atomic force microscopy (AFM) disk which maintained proper vertical spacing and electrical contact between the cell and the sample. The anode samples were prepared as follows, and details on the patterning procedures used is included below:
- (1)Cu: Disks approximately 1 mm thick were cut from a copper sheet and polished with an approximately 2 cm × 2 cm section of SiC sandpaper (800-grit sandpaper average abrasive particle size: 21.8 μm) rubbed in a circular fashion over the exposed surface of the anode to remove any residual surface contamination from storage and apply a topography variation that would be identifiable in AFM. This patterning procedure resulted in randomly oriented linear scratches with a depth between 100 and 200 nm and a scratch width of between 1 and 3 μm.
- (2)Au: The sample preparation process was identical to that for the Cu samples. After cutting the copper sheet and polishing it, 300 nm of Au was deposited on top of the sample by sputter deposition.
- (3)Li: Small sections of Li coated Cu foil (Li approx. 10 μm thick) were backed by an iron AFM disk to maintain good electrical contact with the working electrode terminal of the Asylum Electrochemical Cell. In some cases, the foil had to be folded before being loaded into the Asylum Electrochemical Cell to maintain appropriate thickness. After being loaded into the electrochemical cell, scratching was performed using a diamond coated AFM tip to produce an approximately 2 μm deep and 30 μm long scratch that would serve as a landmark/comparison point for variations in deposition behavior. These folds were preserved during transfer between the Electrochemical Cell for cycling and the Electrical Closed Fluid Cell for imaging after the samples were cycled, to avoid disturbing the surface.
After preparing the anode and loading it into the cell, this assembly was then sealed from the top using an electrolyte-compatible membrane (FFKM). The counter electrode was a bulk sample of Li metal in excess of the size of the exposed region of the working electrode (anode sample), and was attached to a copper wire threaded through the fluid ports of the Electrochemical cell and sealed with a section of PTFE tubing.
After being assembled in this manner inside a glove box maintaining <1 ppm H2O and O2, and any further pre-cycling patterning (initial patterning of the Li anode sample through contact-mode scratching, and no further patterning of the Au and Cu samples beyond the sandpaper treatment received earlier in the sample preparation) the cell was filled with 1.15 M LiPF6 electrolyte (solvent 3:7 parts Ethylene Carbonate to Ethyl Methyl Carbonate) solvent fed through the cell's fluid ports with a gas-tight tip-less syringe with Luer lock, and the whole assembly (syringe, tubing, and cell) was removed from the glove box for biasing experiments.
Electrochemical cycling was performed using a Keithley 6430 source, connected to the Asylum Electrochemical Cell. Low current galvanostatic cycling was performed at 19.242 μA over an exposed circular area with a diameter of 0.7 cm. This corresponds to a current density of approximately 0.05 mA cm−2 at the working electrode (anode). The current was uniformly applied in the case of Li and Au anodes for ∼5 min at a time, with a similar period of 5 min rest to measure the Open Circuit Voltage (OCV); this same current density was used in the case of the Cu anode, but the galvanostat was programmed to swap the polarity of the current applied if the cell voltage left a given voltage range (0–3 V initially, reduced to 0.5–2.5 V after the first experiment on Cu), in order to avoid electrochemical reactions unrelated to Li. This protocol was required because the Cu anode would quickly (<20 s) reach a voltage above this range, even with the low current applied. After biasing, the cell was returned to the glove box, then drained of electrolyte. The working electrode surface was then rinsed with acetonitrile to prevent salt from drying on the electrode surface, the cell was disassembled, and the working electrode sample was moved to the Asylum Electrical Closed Fluid cell for post-cycling characterization of the electrode samples with AFM methods namely: (1) Kelvin Probe Force Microscopy (KPFM), and (2) Electrostatic Force Microscopy (EFM).
For the purposes of this analysis, investigation was focused on the deposition behavior of Li and the surfaces of the conductive electrode were assumed to be uniform (any effects associated with grain boundaries (GBs) or crystallographic orientation are neglected). Prior work shows that GB potential variations can occur, 13 but even in chemically inhomogeneous samples they do not do so universally, and if they do occur they do so on the scale of ∼10 nm, resolution below that of the Kelvin Probe Force Microscopy (KPFM) methods used herein. The focus on anodic behavior is because that is when previous work suggests most of the changes happen to the electrode (when most of the SEI forms at the surface). 14 This follows from the Butler-Volmer (B-V) equation: previous work calculates the value of the charge transfer coefficient ("α" as defined in the B-V equation) as 0.22 in Ethylene Carbonate based electrolyte. As the cell is cycled, the activation barrier of the Li+ reduction reaction changes by approximately 3.5× as much ((1 – α)/α, the ratio of the shifts in barrier heights of reactions in response to an overpotential, as derived from the B–V equation) 15 as that of the Li oxidation reaction changes in response to bias Error! Bookmark not defined.. SEI formation occurs mostly on Li deposition because it is then that the free energy of the involved species changes the most.
KPFM is a commonly used technique to map surface potential variations, 16 and here we have used it as an indication of changing SEI composition. Surface potential encodes chemical information similar to, if not the same as, that of the Fermi level of the material. 16 Assuming the underlying anode surface is uniform, changes in surface potential must be due to changes in the SEI forming above it, or if the SEI is especially thin, on the thickness thereof. 17,18,19 If a separate solid phase were to form in the SEI, it is likely that this phase would have a different interaction with the tip than the surrounding material, something that would be noted in the AC behavior (amplitude and phase) of the tip during topography measurements. As this is not observed, we conclude that the observed surface potential variations do not correspond to a secondary phase and must instead correspond to concentration variations of some species within the phase as well as the work function variation of the underlying substrate.
EFM has been used previously to illustrate spatial variations in the conductivity of a sample, 20,21,22 and has also been shown to be sensitive to the electrical behavior and depth of features beneath a non-conductive surface. 23 In this paper, we use the electric force felt by the tip as a proxy for the distance to a conductive surface (the anode) beneath a non-conductive coating (i.e., the SEI). As the distance to the conductive surface decreases, the electrical force felt by the tip increases (because the tip-sample voltage is fixed). The topography of cycled electrodes necessarily includes some amount of SEI on the surface in most cases, which in a functioning cell is an electron insulator and ion conductor. The SEI should then offer contrast in EFM based on variations in electric permittivity, trapped charges, conductivity, and/or its thickness.
For comparison with the following findings, supplemental Fig. S1 (available online at stacks.iop.org/JES/168/020534/mmedia) contains a diagram illustrating the theoretical predictions of the response of each anode to Li metal deposition based on the coexistence of their solid phase with Li metal, and the overpotential required to deposit Li. These principles have been discussed with greater detail when applied to electrochemistry in previous work, 7,24 and in general in textbooks concerning the nucleation behavior of solid phases. 25
Results
Cu electrode results
The Li deposition was performed on Cu anode under two different voltage limit conditions: (i) between 0 V and 3 V vs Li, and (ii) between 0.5 V and 2.5 V vs Li. The first setting resulted in additional electrochemical reactions unrelated to Li deposition (likely involving the stripping and re-electrodeposition of Cu onto the anode), and the details are given in the supplementary information (Figs. S2 and S3). In the second case, deposition did not occur in most locations on the sample, and instead appeared to be highly localized in one region (Fig. S4). In contrast to the previous experiment, scans of the region with high density of Li deposition as shown in Fig. 1, show interesting features. Scans of this region indicate a smooth topography (approx. 70% as much Root-Mean-Square local curvature as a reference location on a sample before lithium deposition, where curvature is defined as the Laplacian of the sample topography at each pixel) (Fig. 1A), but surface potential measurements from KPFM (Fig. 1B) indicated contours of low surface potential (∼20 mV lower than the surroundings) that were consistent between scans with little to no co-incidence with either topography or tip interaction changes. This absence of co-incidence can be illustrated in the AC phase measurements shown in supplementary information, Fig. S5.
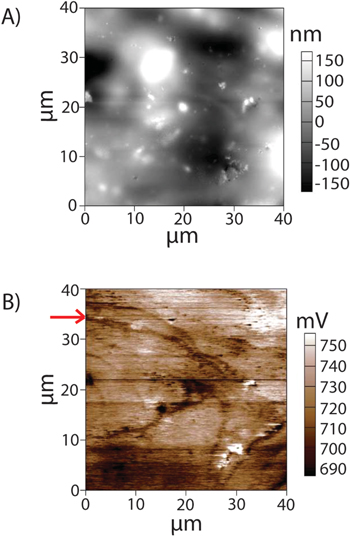
Figure 1. Shows (A) topography, (B) surface potential of a region with significant lithium deposit. Figure 1B shows a series of consistent contours of low surface potential without obvious topography or mechanical correlation, the start of one of which is indicated by a red arrow on the Y-axis.
Download figure:
Standard image High-resolution imageAu electrode results
KPFM measurements on the gold sample suggested small regions of chemical contrast could form, and are discussed in supplemental Fig. S6. Surface potential characterization on the scale of a single deposits was not possible due to the small size and significant curvature thereof, but larger scale variations in surface potential are noted.
Figure 2 shows the data from EFM scans on a much smaller region of this gold sample after galvanostatic biasing for a total of approximately 2400 s in 600 s (10 min) intervals of lithium deposition, with approximately 360 s of open circuit relaxation and 30 s of galvanostatic lithium stripping behavior at the same current, to help ensure the electrolyte does not polarize excessively. The response largely appears to mirror the sample topography (expected in the case of a thin, insulating, imperfectly dielectric SEI, and discussed in greater detail in the corresponding discussion section), with the exception of the image in Fig. 2B. Figure 2B appears to broadly reflect topography, but with an overlay that appears to reflect local curvature (crevices between deposits are highlighted, the tops of deposits are darker). These patterns in the amplitude signal do not change appreciably in response to the polarity of bias applied between the tip and sample, do change in response to changing the frequency to which the cantilever is tuned (and thus, the average phase response of the image), and match topography much more clearly when taken with the tip tuned on the right shoulder (frequency above the tip's resonance) as opposed to the left shoulder (frequency below the tip's resonance, see Fig. S8). This is due to the long-range nature of the attractive force provided by the tip-sample bias distorting the relationship between amplitude and phase in AC AFM, and is discussed in further detail in the corresponding discussion section. The patterns in EFM phase response (low on peaks, high in valleys) are qualitatively the same throughout.
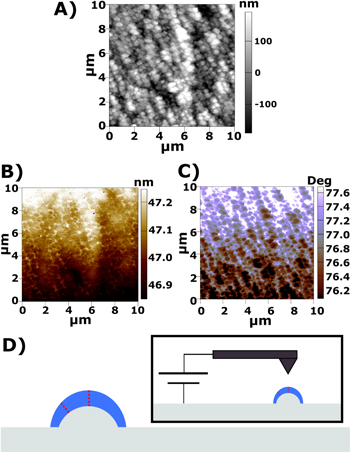
Figure 2. Shows (A) topography, (B) the EFM amplitude, (C) the EFM phase corresponding to the cycled gold sample. (D) Is a diagram illustrating the variation of SEI thickness on the surface of the sample (blue) that can effectively result in a varying EFM sample height (red dotted line) which would explain the EFM phase variation observed across the deposits. Contrast is noted in the slow scan direction ("Y axis") due to resonance drift, but besides that the EFM phase should monotonically correlate with the distance to a conductive or strongly dielectric region.
Download figure:
Standard image High-resolution imageAu deposit statistical analysis
Figure 3 illustrates the analysis performed on the deposits that appeared on the gold sample, which showed some statistically significant difference between random and the observed incidence of growths on the cycled gold electrode. After gathering topography data on the Au sample, the software used to operate the instrument (Igor pro v6.37 Asylum MFP3D Software version 14.13.134) is used to generate a "mask" over the data, effectively indicating regions where the sample height reaches a specified threshold distance above the average height of the image. These highlighted regions should indicate the largest deposits of Li, and their distribution in the sample relative to the pre-patterned regions gives insight into where dendrites are likely to form. By comparing the locations of these deposits to the locations of surface patterning, it is possible to determine whether these prefabricated patterns play any role in the nucleation and subsequent growth of dendrites on a microscopic scale. However, it should be noted that these effects are not the only ones that occur in this system. This analysis only addresses local variations in nucleation and growth, and as such it neglects the global effects of applying the topography variations analyzed here to the whole electrode, such as decreased area-specific current density and overpotential due to the increased surface area of the roughened electrode, or effects relating to electrolyte consumption that may differ slightly from the case of a flat anode due to the preferential growth of some nuclei over others.
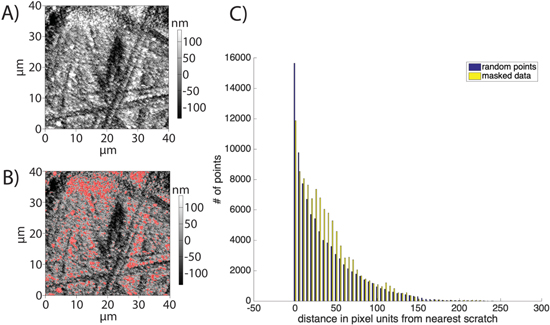
Figure 3. Shows (A) raw topography of the sample area in question, (B) topography flattened to remove large height gradients across the sample and masked to highlight regions above a 100 nm height threshold. In principle, this should indicate the largest variations in the height of the sample, thus highlighting large deposits, and (C) data illustrating, for the same number of points, the preferential deposition of Li in a region between 600 nm and 2.4 μm from the nearest scratch (as calculated from the size of a pixel, given the 40 μm width of the scan and the 1024 points in the scan).
Download figure:
Standard image High-resolution imageThe original topography (Fig. 3A) was processed to remove long-range variations in height, and masked as discussed previously (Fig. 3B) to identify the locations of large deposits, and the locations of the masked pixels were compared with an outline (Fig. S11) of the scratches in the surface; statistics were compiled for the distance of such points to the nearest scratch edge. Because the sudden decrease in height associated with a scratch prevents appropriate masking of deposits that occur at the bottom of a scratch, there were significant differences in the amount of material "deposited" in the scratch in random distributions and in raw data. Neither completely eliminating the possibility of deposits in the scratch (discounting points with a distance of zero to the scratch in analysis) nor leaving them in produces reasonable data in this region. For that reason, data between 0 and 5 pixels from a scratch edge is not used to draw conclusions.
It should be noted that the median distance of a deposit to the nearest scratch is much higher in the experimental data than in random distributions (32.2 pixels (px) in the experimental data (1.25 μm) vs 29.7 px (1.16 μm) ± 0.22 px (8.5 nm) in random distribution data if randomly distributed points with zero distance to scratch are discounted, and necessarily less if they are included). The difference in the mean distance to the nearest scratch is less than the difference in median distance to the nearest scratch in all areas examined. On closer inspection (Fig. 3C), these differences appear to be due to a preferential deposition distance of approximately 600 nm − ∼2.4 μm distance from scratch (15 px−∼50 px). As most of the deposits in these regions appear to have a size on the order of 200 nm−500 nm (5 px−12 px), this suggests that narrow scratches promote deposition in an area around the scratched region. Similar behavior is noted in two other regions selected for analysis, and in each of these cases lithium preferentially deposits in at least a range of 600 nm−1.6 μm from the nearest scratch.
Li electrode results
On a galvanostatically biased lithium sample, EFM (Fig. 4) and KPFM (Fig. 5) data were taken. Step-like structures appear in the EFM scans of the lithium sample (Fig. 4B).
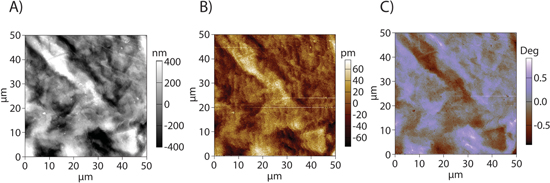
Figure 4. Shows (A) topography, (B) EFM amplitude, and (C) EFM phase response of cycled Li anode. The latter two images have been modified to remove the contribution of the resonance drift, as was indicated by a gradient in the AC phase along the Y axis.
Download figure:
Standard image High-resolution image
Figure 5. Shows (A) topography and (B) KPFM data from a cycled Li anode around a prefabricated scratch. The red dotted ellipses in part B indicate imaging artifacts, the bottom left one suggests these deposits might be especially fragile (such that the tip can disturb them with AC topography imaging).
Download figure:
Standard image High-resolution imageFigure 5 shows KPFM on Li in the vicinity of a scratch applied to the surface with an AFM tip before cycling. A region in the upper right displays a significant potential shift (approx. +200 mV) that appears to be unrelated to local topography variations, suggesting that there is an underlying potential difference. The existence of such a difference in the surface potential suggests a chemical difference between the SEI that forms on new deposits, and that of previously exposed Li. The artifact in the lower left suggests further differences between deposited Li and the underlying anode structure by suggesting that this feature is something that the tip can disturb or otherwise remove if it contacts the surface.
Discussion
To help understand the interpretations of anode behavior to follow, phenomenological simulations of the AFM tip performed with several normalizations under electrical bias and assuming the mechanical response of the tip takes the form of a driven and damped harmonic oscillator have been performed using the velocity Verlet integration 26 method, and force-distance curves in the format of AC AFM have been produced to illustrate how different forces acting on the tip change its motion (Fig. 6, see the corresponding section of supplemental information for details on how this simulation is performed). In addition to the driving and damping force applied, tip-sample interactions are simulated with a Lennard-Jones potential and a long-range electric force acting on the tip. The electric field acting on the tip is not explicitly shown in this figure, but is simulated here to scale as 1/r2 between the tip and the sample, so the x-axis in these plots serves as a proxy for electrostatic force felt by the tip such that as the tip approaches the sample or the amplitude increases the mean electrostatic force it experiences over its range of oscillation increases. Note that the tip height shown refers only to the distance between the sample, and the point at which the tip experiences zero elastic force due to its own displacement (or more explicitly: that tip's asymmetric oscillation under the long-range attractive force is not included in the tip height shown on the X axis). The phenomenological simulation of AC dynamics shown here is illustrated with chosen values of damping constant, Lennard-Jones potential, and electrostatic interaction strength that highlight certain dynamics, and specifically illustrates that under the conditions that mimic AFM tip motion larger electric force generally results in increasing EFM mode phase response, and that in these conditions there exists a point outside of simulated contact with the sample where closer approaches to the surface, and thus increasing electric force acting on the tip results in a decrease in amplitude response from the tip, instead of the increase that appears in the long-distance limit. In other words: an inversion in amplitude contrast (the change in amplitude that occurs in response to increasing electrostatic force) occurs for tips being driven on the left shoulder (below their mechanical resonance frequency).

Figure 6. Shows: (A) the amplitude, and (B) the phase response of the tip as a function of sample height when tuned to a frequency 5% less than its resonance frequency. As the tip approaches the sample, the electrical bias between the two exerts an electric field that applies a force to the tip, and the amplitude response is non-monotonic, as indicated by the difference in slope between the long distance limit and the region between the dotted lines in (A). Due to the scale-independence of the simple harmonic oscillator model (always a sine curve) upon which this simulation is based, physical units cannot be assigned to it without knowledge of some of the other parameters, such as the free air damping constant of the tip. While deriving exact values would require using the Euler–Bernoulli beam equation, this harmonic oscillator model is sufficient to reproduce the qualitative dynamics of low-amplitude, first-harmonic AFM scans.
Download figure:
Standard image High-resolution image
In these simulations, this inversion always occurs at the frequency corresponding to the peak of the amplitude vs frequency curve, as one might illustrate with an AC frequency sweep while tuning the tip. The anomalous phase value at which this contrast inversion occurs in our data can be explained by an additional tip damping contribution coming from the sample, which is examined in further detail in Fig. S7. Damping that results from local conductivity in EFM has been discussed in literature previously, 27,28 and a simulation of tip damping with these scaling properties reproduces behavior like that seen in these experiments. The apparently significant contribution of EFM tip damping to its AC response, in a manner consistent with damping resulting from locally induced current in the sample due to the motion of the biased AFM above the sample, suggests that significant information could be gained in these samples from scanning non-contact impedance microscopy measurements.
Cu anode
Because of the very small surface potential variation in the vicinity of the topography changes noted on the Cu sample, it is believed that these changes could not be associated with lithium deposition, but with side reactions such as the electrochemical stripping and plating of Cu. To avoid this possibility in subsequent experiments, the voltage limits were reduced to between 0.5 and 2.5 V vs Li.
In the subsequent experiment on Cu, one location of very large deposit was noted, with a much smoother topography than the original sample and contours in surface potential. If a separate material phase were to form in the apparently soft Solid Electrolyte Interphase (SEI), it is expected that there would be a variation in mechanical or tip-interaction properties as a result, but this is absent from the AC-amplitude and phase data as shown in Figs. S5b and S5c. The absence of these corresponding features, or significant topographic variation which contributed to the previous figure's (Fig. S2) variation in surface potential, suggests that the variation is a result of some change in chemical concentration (such as an increased/decreased concentration of salt, for example) in the same phase, rather than a wholly different material. The relatively smooth topography suggests that a soft Solid Electrolyte Interphase (SEI) has relaxed over the surface of the material (whose topography should otherwise be similar to the pre-cycling topography of Cu and Au electrodes, see Fig. S2 for an example), so it's likely that these changes are being measured in the SEI.
Local variations in SEI could have a significant impact on the formation of dendrites by promoting non-uniform conductivity of Li ions through the SEI, and thus resulting in non-uniform deposition. The appearance of this feature suggests a chemical variation in the SEI which may be related to the deposition behavior of Li when large quantities thereof deposit and may be generalizable to Li metal because of the identical chemistry involved.
Au anode
EFM responses on the Au electrode can provide insight into the local electrical properties of the SEI. Regions where a conductive/strong dielectric surface is closer to tip will exert more attractive force on the sample and result in a different EFM response. This highlighting pattern, and the corresponding phase image (Fig. 2C), suggests that the crevices between deposition "nodules" exert more attractive force on the tip than the peaks do. The pattern in Fig. 2B could be explained by the competition between the amplitude response of the tip and the long-range electrostatic force: the tip will experience more attractive force in regions where the electrostatic force between tip and sample is stronger, causing the amplitude to increase so that the tip comes closer to the sample, but that also causes the mechanical resonance of the tip above the sample to shift. If this force is great enough that the attractive force acting on the tip causes the resonance frequency to shift past the frequency at which the tip is being driven, the amplitude response of the tip will decrease because it is effectively being driven at a frequency that is far from resonance. Images taken while the tip is tuned on the right side of resonance display clearer amplitude contrast in EFM mode, as shown in Fig. S8, which supports the validity of this interpretation and the corresponding simulated AC responses for this purpose in Fig. 6.
Topographic effects can explain some of the data shown here (as illustrated in Fig. S9, where the tip experiences a stronger electric field near a concave region than it does in flat areas, which is consistent with the stronger electric force observed in the "valleys"), but fail to completely explain the contrast on the nuclei: if they're conductive/strongly dielectric then the signal on the edges of large nuclei should indicate less attractive force than the signal on small nuclei or the centers of large nuclei because the peak of the nucleus is flatter, and more convex topography at the edges would cause the sample-induced electric field to spread more quickly. If the nuclei were uniformly insulating and weakly dielectric, then the signal would be uniformly reflecting of sample height, which generally appears to be the case, but solely explaining the observed data through topographic features would require a significant point spread in measurement, which would likely result in less spatial resolution than is observed in images of this area (see Figs. S8D–S8F and Figs. 2A–2C), and would also suggest that the edges of the "trench" between 6 μm and 8 μm on the X axis be highlighted to a greater degree than the middle of said feature, which is not observed. Additionally, these deposits should correspond to the nucleation of lithiated phases (otherwise, there would be no reason for the SEI to thicken in that area), so it is expected that the conductive surface beneath these nodules be closer to the tip than it would be at an equivalent height above the sample in free space.
The EFM phase responses shown here counter-indicate standard AC-AFM signal (because the amplitude should not increase as phase goes further from resonance) and trapped charge (because the pattern is the same regardless of the polarity of the bias applied, see Fig. S10) as explanations of the observed responses. An accumulation of imperfectly dielectric SEI on the "peaks" of the sample would explain the apparent higher force in the "valleys" of the sample, because the SEI would be thicker there and thinner in the valleys elsewhere (illustrated in Fig. 2D), resulting in a variation in the distance to the metal electrode that would produce the observed change in EFM signals. While additional measurements could be taken after allowing further deposition (and thus accumulation of SEI) to occur to examine this in greater detail, such an experiment would likely obscure the original anode topography and thus prevent the correlation of deposit locations with convex topographic features as was also performed in this work; the results of that statistical analysis are discussed in the next section.
Au statistical analysis
The range of distances from the nearest scratch in which preferential deposition occurs is much larger than the characteristic size of the convex scratch edge, which suggests that the enhancement of deposition by local electric field is not the cause thereof. This phenomenon could conceivably be explained by a local excess of Li around the scratches, which would allow the regions near the scratches to deplete the electrolyte less quickly and thus deposit more material. Such an excess could result if conditions inside the scratch were unfavorable to deposition (possibly explained as a result from the reduced surface-normal electric field in such trenches) such that the Li ions in the electrolyte originally in scratched area would diffuse to the surrounding surfaces.
Due to the uneven surface topography, we are unable to quantitatively confirm a relative dearth of deposition within the scratched regions in our samples using these methods, but if this is an appropriate explanation it is expected that the preferential deposition range's upper bound and lower bound decrease with increasing current/overpotential (as the electrolyte depletes more rapidly, and the deposits that form should be smaller as a result of the increased overpotential), produce relatively larger deposits in the same size of preferential deposition region as the depth of scratches in the surface increases with constant scratch width (as there are more Li ions, at the same concentration, available to diffuse along the same paths to the Li-poor regions of electrolyte on the surface), and produce a larger upper bound of the preferential deposition range with increasing electrolyte salt concentration and constant diffusive properties (as it would require more current to deplete the electrolyte) or increasing electrolyte diffusivity and constant salt concentration (as the Li ion excess could diffuse farther before being depleted).
Li anode
On the Li anode, it is unlikely that the features in EFM amplitude (Fig. 4B) are a result of trapped charge, as the images do not change significantly when the voltage applied to the tip is reversed. While step-like jumps could occur as a result of poor surface tracking, these jumps would be approximately uniform in width, with a uniform decay towards the surface, and positioned in a manner well-correlated with sample features that would trigger the failure to track the surface, which is not seen in the images. These features tend to match corresponding changes in EFM phase, suggesting that some of these features are associated with the previously mentioned competing influences of increased electrostatic force and changing mechanical resonance frequency. While this data cannot be used to determine the exact height of the surface, they should be monotonically related: higher phase corresponds to higher attractive force, which implies the tip is closer to a conductive/strongly dielectric surface than regions where the phase is lower because they indicate a stronger electrostatic interaction between the tip and sample. The variations in EFM phase signal are small, and perfectly mirror sample topography, suggesting that most of the signal in this image is associated with topographic cross-talk rather than SEI properties. This might be the case with an exceptionally thin or uniform SEI.
The Li KPFM data shown here (Fig. 5) is believed to reflect the Li anode in its post-cycling condition accurately, and to track the surface in a largely appropriate manner, because there is no contrast between the scratched and unscratched region in KPFM despite the changing sample incline (other than the right edge of the scratch, which occurs opposite the observed variation in surface potential on the deposit). The surface potential variation of the SEI suggests that deposition in the low current/overpotential limit can result in an SEI with local chemical variations around large deposits of Li metal, in contrast to the previously discussed EFM data in a sparsely deposited region. This local surface potential contrast suggests that the SEI that forms on large deposit has a different chemical composition than the surrounding SEI. This altered composition may perform differently as a lithium ion conductor than the surrounding material and thus inhibit the uniform deposition of lithium.
Conclusions
The thickness of the SEI does not appear to be uniform in any of the cycled samples (Li and Au, as suggested by EFM, and in Cu based on the topography change after cycling). In Cu SEI appears to "settle," smoothing out the surface when compared with the underlying conductive electrode. While a similar SEI behavior has been noted previously, wherein Li2CO3 was detected outside regions of significant Li deposition, 29 this previous work could not comment on any variations in thickness of the SEI that formed. This inhomogeneous path length of lithium ions to the electrode could aggravate the formation of dendrites, and conversely, a stiffer SEI would avoid this by not relaxing over the surface in this manner. This could contribute to the merits of an inorganic-rich SEI that have been mentioned in previous literature. 30,31,32
Data from KPFM measurements on Cu and Li metal anodes suggests that the SEI that forms on the surface of Li is not homogeneous. What variations were observed in surface potential coincided with large deposits, suggesting that the chemical inhomogeneity either contributes to or results from an accelerated deposition of Li metal. Regardless, these variations could contribute to local variations in the deposition of Li, which can result in further nonuniformity of Li deposition on subsequent cycles and, especially if they serve as better Li conductors than the surrounding SEI, the local accumulation of SEI through increased local deposition.
In experiments on Cu samples, deposition occurred in a single deposit location, such a behavior is expected for low supplied overpotential, 9 and contrasts the nearly homogeneous deposition on Li and the dense coating of deposits that formed on Au. The intermediate deposition behavior of the Au anode allowed for the identification of discrete deposition nuclei in such quantity that statistical analysis of these deposits could be performed and correlated with the underlying topography. Statistical analysis performed on the locations of deposition nuclei indicated preferential deposition in a distance range of between 600 nm and 1.6 μm from the nearest scratch edge in all areas characterized. A statistically significant difference in median particle distance from the nearest scratch edge in all cases further suggests that sharp concave topographic changes impede nucleation very close to the edge, but encourage the growth of nuclei in a broader local region in the case of slow (low current/overpotential) deposition.
Acknowledgments
This work was supported by the international Collaborative Energy Technology R&D Program of the Korea Institute of Energy Technology Evaluation and Planning (KETEP), granted financial resource from the Ministry of Trade, Industry & Energy, Republic of Korea (No. 20158510050020). S. H. (analysis of KPFM and EFM data) acknowledges the financial support from the Big Sciences Research Program (no. 2017M1A2A2044498) through the National Research Foundation of Korea (NRF), funded by the Ministry of Science and ICT, Republic of Korea and the KAIST-funded Global Singularity Research Program for 2020. Use of the Center for Nanoscale Materials, an Office of Science user facility, was supported by the U.S. Department of Energy, Office of Science, Office of Basic Energy Sciences, under Contract No. DE-AC02-06CH11357.